You must be logged in to post a review.
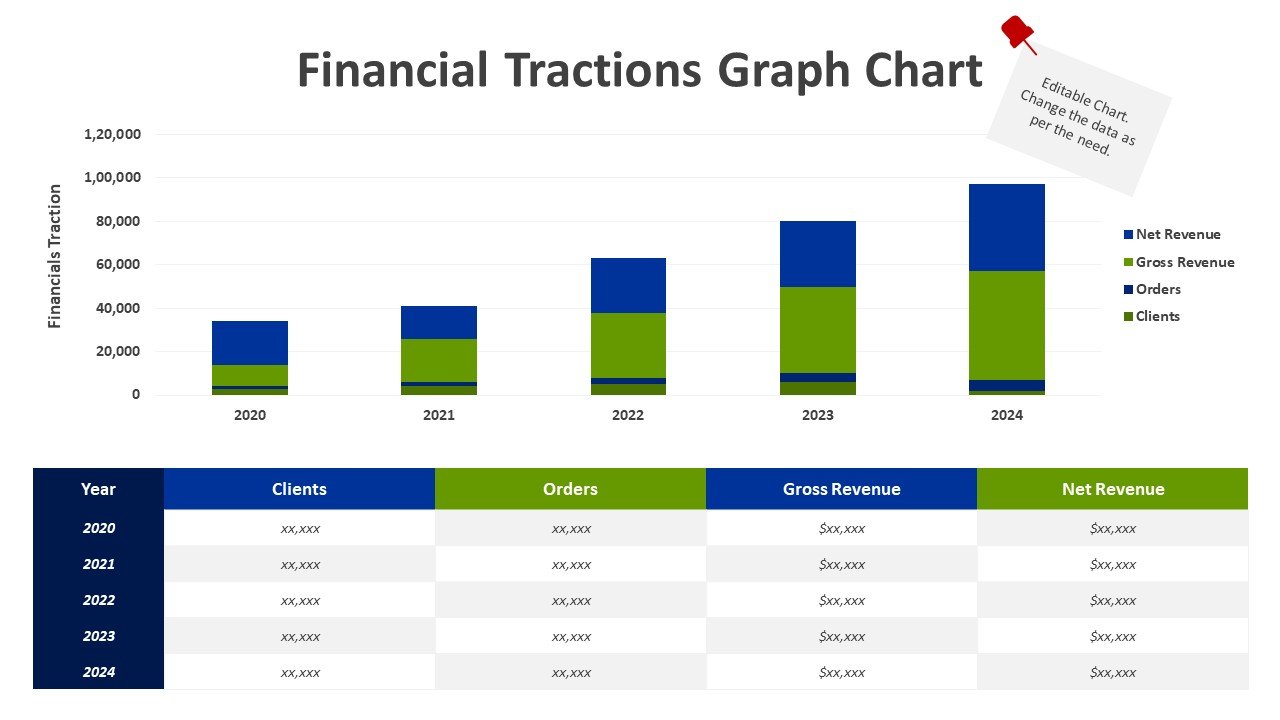


Financial Tractions Graph Chart PowerPoint Template
₹282
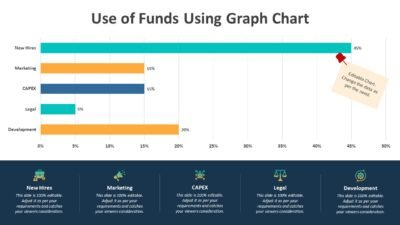
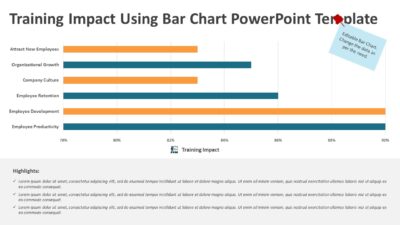
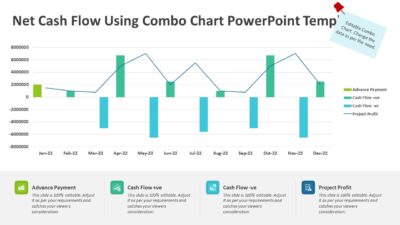
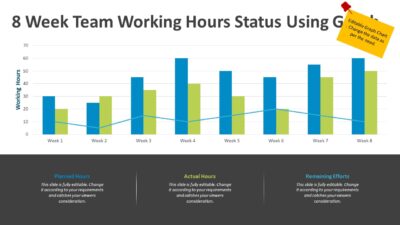
Present your business growth and financial performance with confidence using the Financial Tractions Graph Chart PowerPoint Template. This fully customizable PPT template is designed to help startups, businesses, consultants, and financial analysts showcase key performance metrics in a clear and professional format. The slide highlights important business indicators such as Net Revenue, Gross Revenue, Orders, and Clients, making it ideal for investor presentations, quarterly reports, business reviews, fundraising pitches, and strategic planning meetings. Whether you want to demonstrate revenue growth, customer acquisition trends, order volume, or overall business traction, this PPT template transforms complex financial data into an engaging visual story that is easy for stakeholders to understand and act upon.
Features:
No. of Slides – 01
Widescreen 16:9
Edit “excel” data as per the requirement
Replace texts, icons and image as per your need
“Theme” based colors
Share This:
Reviews
There are no reviews yet.