You must be logged in to post a review.
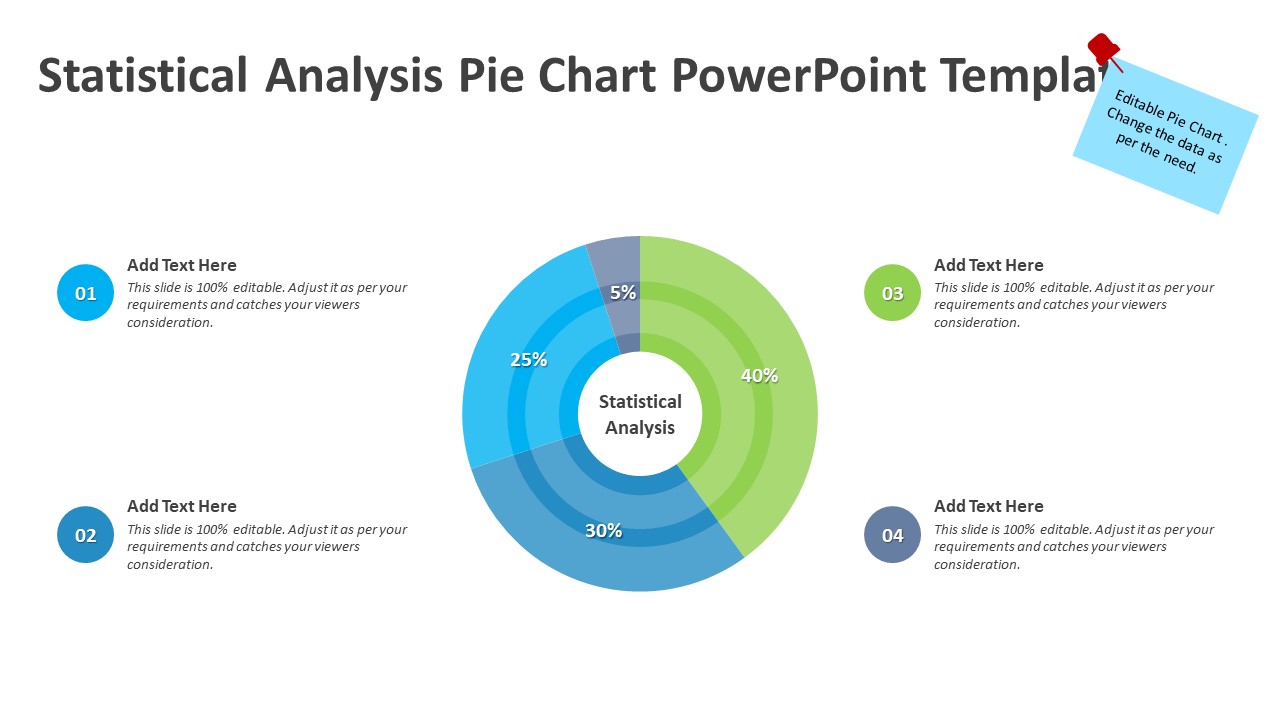


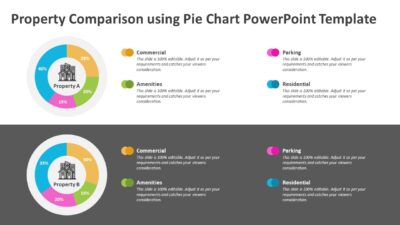
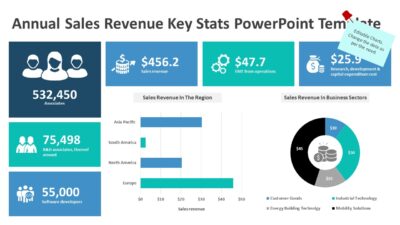
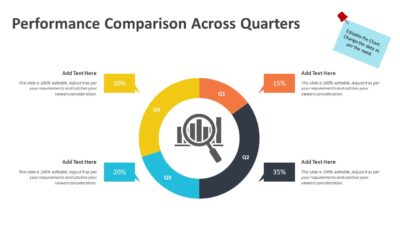
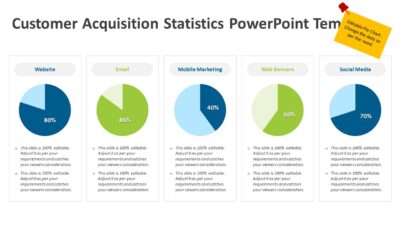
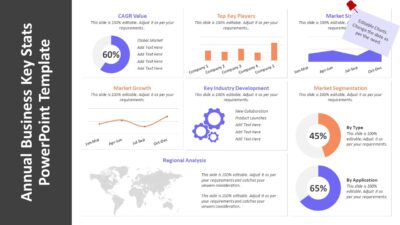
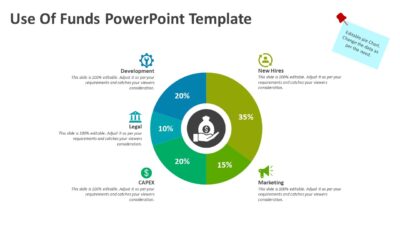
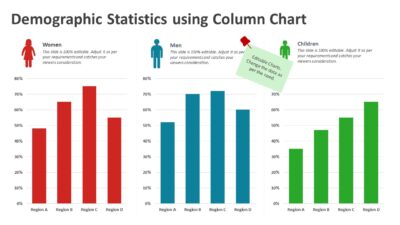
Statistical Analysis Pie Chart PowerPoint Template
₹188
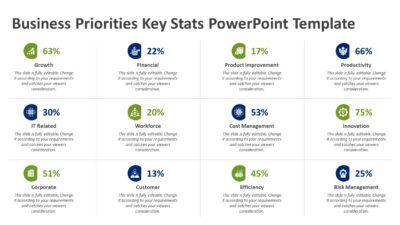
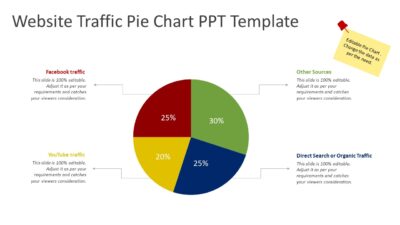
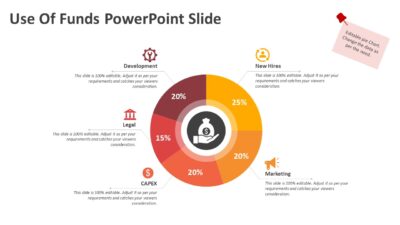
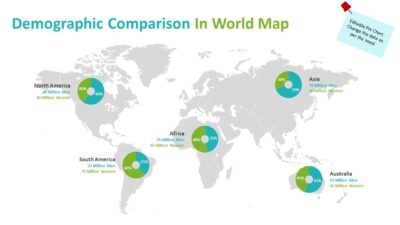
The Statistical Analysis Pie Chart PowerPoint Template is a professionally designed presentation ideal for clearly visualizing statistical data and percentage-based insights. This fully customizable PPT template helps professionals, analysts, educators, and business teams present complex datasets in a simple, visually engaging pie chart format. With a clean layout and data-driven design, this PPT template improves audience understanding and supports effective decision-making. It is perfect for presenting survey results, market statistics, performance metrics, and analytical summaries in PowerPoint.
Features:
No. of slides: 01
Widescreen 16:9
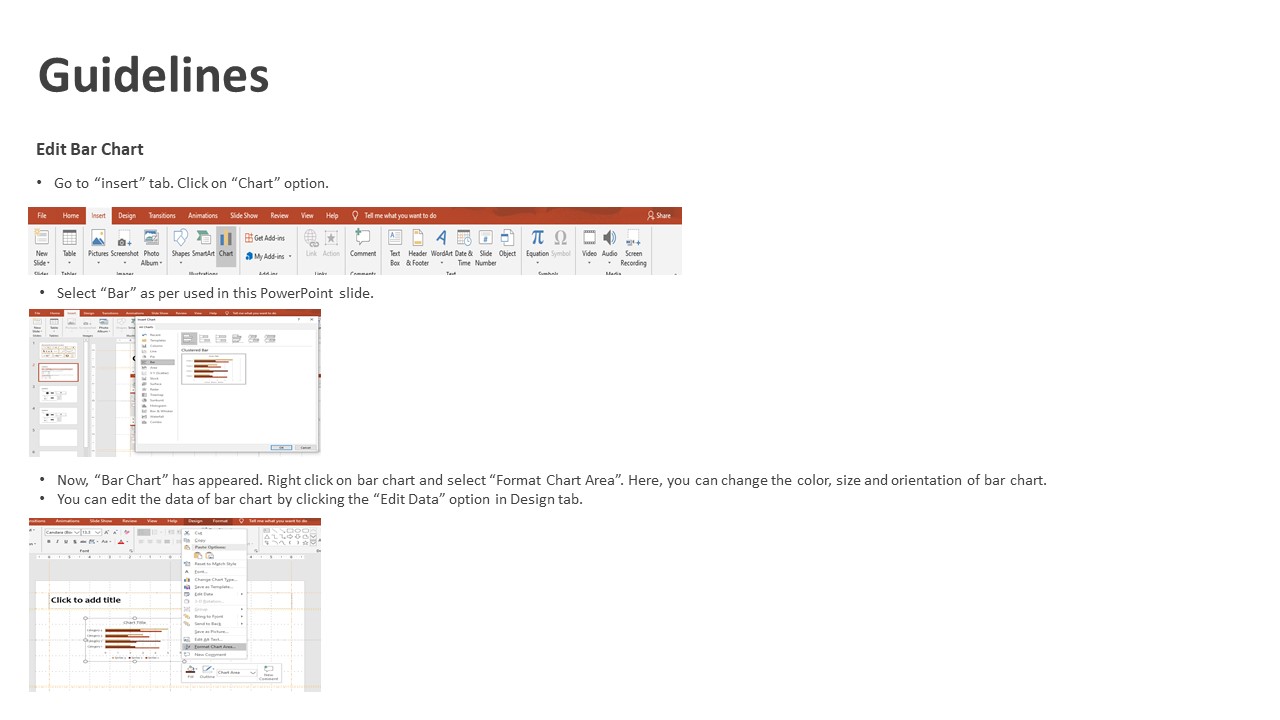
Edit “excel data” as per the business requirement
Replace texts as per your need
“Theme” based colors
Replace icons and image as per the need
Share This:


Reviews
There are no reviews yet.