You must be logged in to post a review.
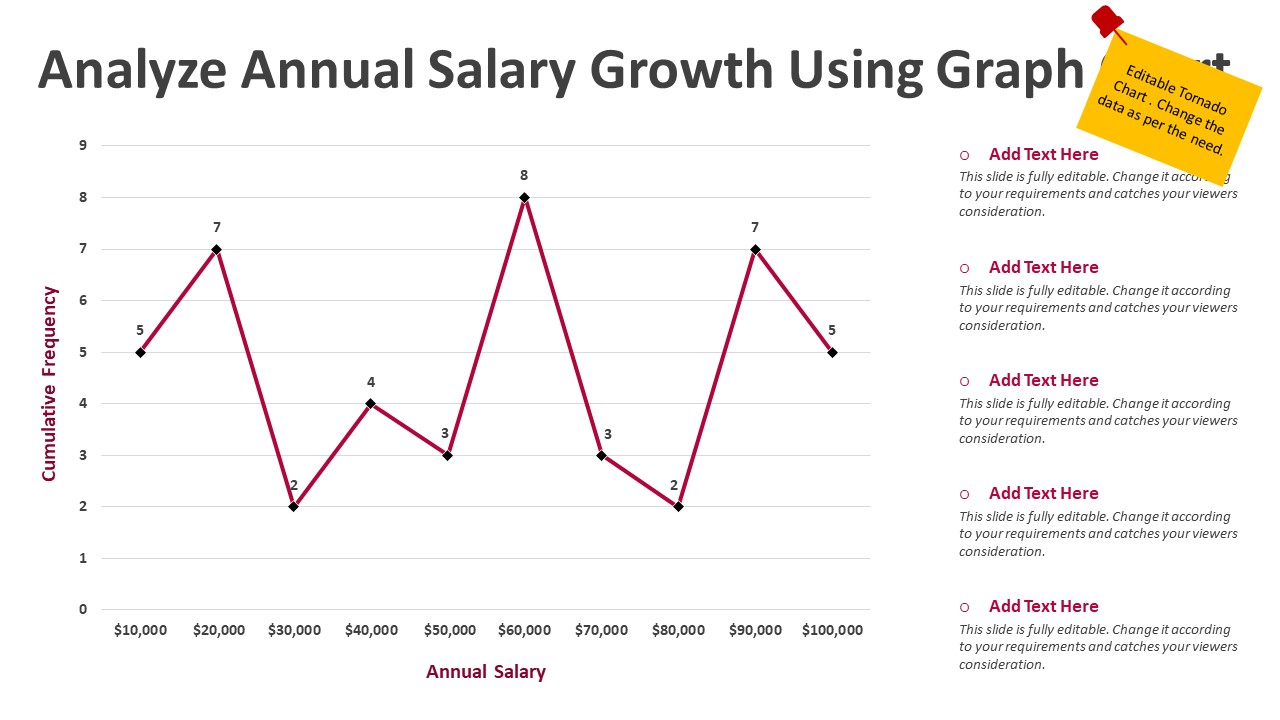


Analyze Annual Salary Growth Using Graph Chart PowerPoint Template
₹188
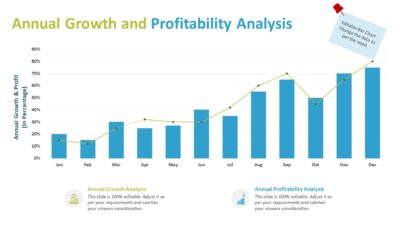
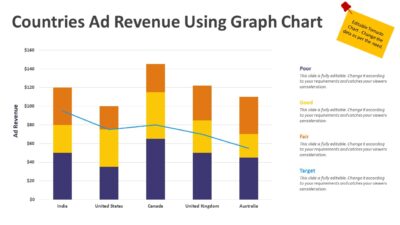
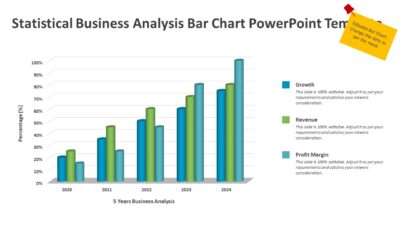
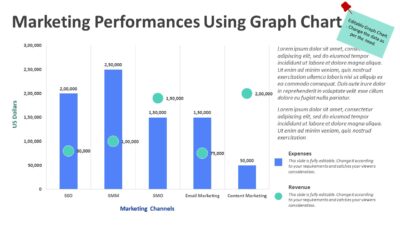
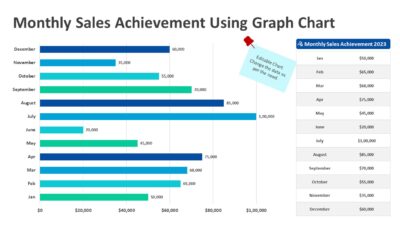
The Analyze Annual Salary Growth Using Graph Chart PowerPoint Template is a professionally designed PPT for visualizing salary trends with clarity and precision. Featuring a cumulative frequency graph and detailed salary range distribution, this PPT template helps present compensation growth in a structured and insightful way. Ideal for HR professionals, business analysts, and corporate presentations, it simplifies complex data into an easy-to-understand visual format.
Features:
No. of slides: 01
Widescreen 16:9
Replace texts as per your need
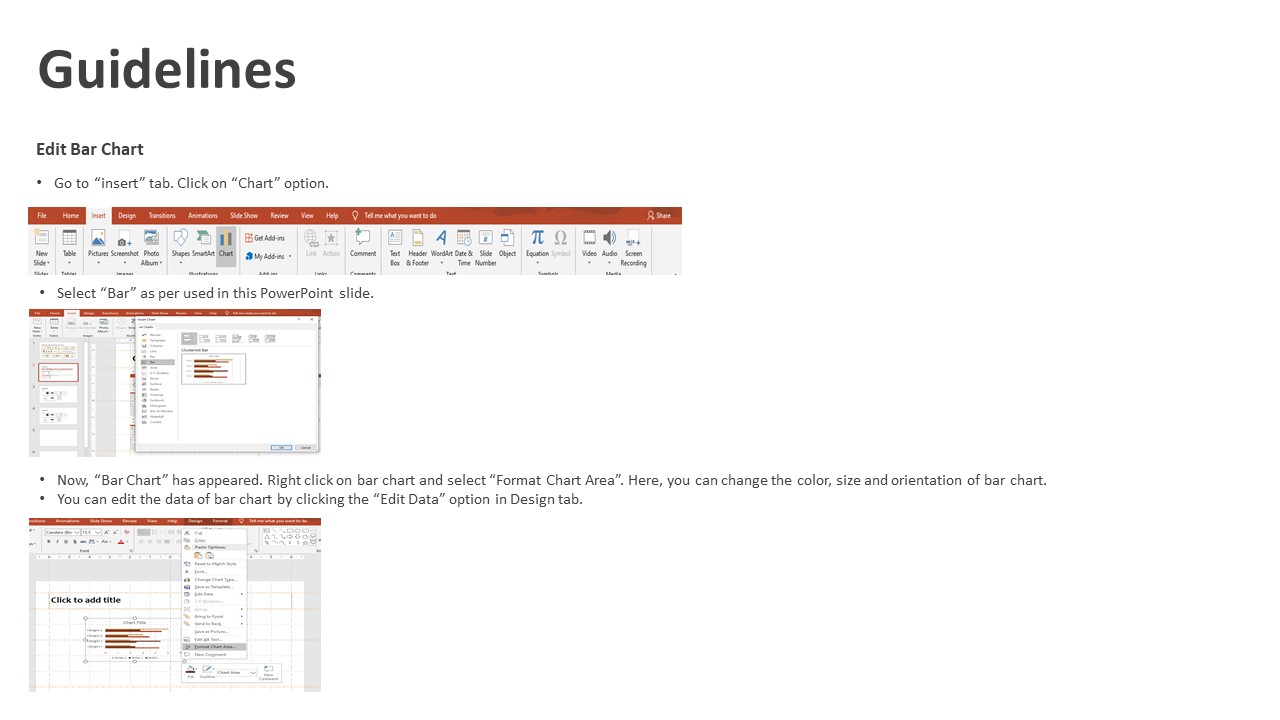
Edit “excel” data as per the requirement
“Theme” based colors
Replace icons and image as per the need
Share This:


Reviews
There are no reviews yet.