You must be logged in to post a review.


Countries Ad Revenue Using Graph Chart PowerPoint Template
₹282
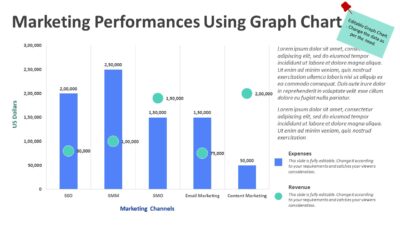
Present global advertising performance with clarity using the Countries Ad Revenue Using Graph Chart PowerPoint Template. This professionally designed PPT template visually compares ad revenue across multiple countries through an intuitive graph chart, making complex data easy to understand. Ideal for marketers, analysts, and business professionals, it helps highlight regional trends, growth opportunities, and market insights.
Features:
No. of slides: 01
Widescreen 16:9
Replace texts as per your need
Edit “excel” data as per the requirement
“Theme” based colors
Replace icons and image as per the need
Share This:


Reviews
There are no reviews yet.